-
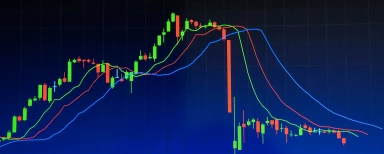
When you trade in financial markets, you start seeing patterns. Price does not move up and down randomly but tends to react at certain levels. Sometimes it rises and then pulls back. Sometimes it falls and then bounces. These levels matter because this is where buyers or sellers take control and push the price in a new direction.
That is exactly why traders pay attention to Support and Resistance Levels. They mark the price zones where the market has reacted before and is likely to react again. Instead of guessing entries or reacting to every candle, you can use these levels to make structured decisions. They bring clarity to your analysis and discipline to your execution.
In this blog, we will break down how Support and Resistance levels work and how you can apply them confidently in real trading conditions.
What are Support and Resistance Levels?
These are areas where price often changes direction. Also, these zones help traders plan moves and read the market clearly. Here’s how it works:
Support
Support is a price area where buying pressure prevents further declines. It usually forms near previous lows. When the price approaches that level, buyers can push it back up, creating a potential entry point.
Resistance
Resistance is a price area where selling pressure stops an uptrend. It usually forms near previous highs. When the price reaches this level, sellers can push it down and slow the advance.
Traders remember how the price reacted at these levels. Large orders make these zones strong and useful for planning trades.
How to Identify Key Price Zones?
To trade better, you need to see where the price can react. Start with a clean chart on a higher timeframe, like daily or 4-hour. These zones are not exact lines; they are areas where buyers or sellers often take action.
Horizontal Levels
Look for points where the price reversed before. Connect two or more highs or lows with a horizontal line. The more times the price reacts, the more significant the level may be.
Trendlines
When price trends, draw a line along higher lows in an uptrend or lower highs in a downtrend. These lines show areas where the price can bounce or encounter resistance as the trend continues.
Round Numbers
Round numbers often act as barriers because traders place orders near them. The price may react around these levels, which makes them worth watching.
Trading Strategies for Key Market Zones
Traders usually focus on two approaches: taking advantage of price bounces within key zones or trading when prices break out of them. Always manage your risk and wait for confirmation before entering a trade.
01. Trading the Bounce
This works best in sideways markets where price moves within a clear range. The idea is to trade when the price bounces off key zones.
- Identify: Find a clear range with a lower zone and an upper zone.
- Enter: Buy near the lower zone or sell near the upper zone.
- Protect: Place a stop-loss just below the level for buy trades or just above the level for sell trades.
- Target: Aim for the opposite side of the range for taking profit.
02. Trading the Breakout
Breakouts happen when price moves decisively beyond a key zone, signaling a possible trend.
- Wait: Let price close beyond the zone before acting.
- Enter: Buy if it breaks resistance or sell if it breaks support.
- Confirm: Look for a strong candle close or a retest of the broken level.
- Protect: Place a stop-loss on the opposite side of the broken zone.
How to Tell if a Support & Resistance Zone is Strong?
Some zones on a forex chart matter more than others. Some only briefly slow prices, while others cause strong reactions. Identifying these key areas helps you trade smarter and focus where price is likely to respond.
01. Check How Often Price Reacts
A zone gets stronger the more times the price reacts to it. These reactions help define support and resistance levels in the market. A few touches may hold, but too many in a short time can weaken the zone. Watching this behavior helps spot where the price may pause or reverse.
02. Look at Higher Timeframes
Zones that appear on daily or weekly charts carry more weight than those only seen on short-term charts. These major zones serve as key price boundaries. Platforms like CapitalXtend make it easier to spot these high-probability areas and plan trades with confidence.
03. Watch Price Action and Volume
Price in a zone shows its strength. Strong reversals or long candlesticks mean buyers or sellers are active. Increased trading volume at these points confirms the zone’s strength and shows real market participation.
Common Mistakes to Avoid When Trading Support & Resistance
Trading effectively requires discipline and avoiding common errors. Recognizing these mistakes can protect your capital and improve your results.
01. Too Many Lines on the Chart
Adding every minor high and low creates clutter and confusion. Track key levels that the market has tested several times. A clean chart makes it easier to make quick, confident decisions.
02. Ignoring Higher Timeframes
Short-term charts can be misleading. A breakout on a 15-minute chart may fail if a major level exists on the daily chart. Always check higher timeframes first to understand the main trend and avoid trading against stronger forces.
03. Treating Levels as Exact Lines
Price is rarely precise. It may move slightly past a level before reversing. Treat zones as small areas, not single lines, and use a small buffer for entries and stop-losses. This reduces the chance of being stopped out by normal market fluctuations.
Your Path to Confident Trading
Successful trading comes from observing how the price reacts at key zones and making informed decisions. By applying these strategies and avoiding common mistakes, you can trade with more confidence and clarity. With CapitalXtend, you can analyze charts, spot key levels, and make informed trading decisions.
Always focus on the zones that matter and manage your risk carefully. With practice and discipline, mastering these key levels can help turn insights into consistent, confident trading decisions.
Take action today with CapitalXtend and build your trading strategy on a strong, professional foundation.
Frequently Asked Questions
Q1. What is Support and Resistance level in trading?
A. Support is a price level where buying pressure may stop a decline. Resistance is the point at which selling pressure may halt a rise. These zones guide traders on potential market reversals.
Q2. What is S1, S2, S3, R1, R2, R3 in trading?
A. These are pivot point levels used to identify potential support (S1, S2, S3) and resistance (R1, R2, R3) zones. Traders use them to plan entries and exits and to manage risk.
Q3. How do traders use support and resistance in day trading?
A. Traders watch these zones to identify entry and exit points. Price reactions at these levels can signal bounces or breakouts, which help traders make short-term decisions with better risk management.
Q4. Can support and resistance levels change over time?
A. Yes. Market conditions, trends, and new price action can shift these zones. Traders must update their charts regularly to account for the evolution of both of these levels.

Breakout Trading Strategy: The Complete Guide
Most traders blow their first account within 90 days. Breakout trading is usually why. They spot EUR/USD breaking above 1.0850 after weeks of consol...
How do Interest Rates and Inflation Affect Forex?
Big moves in the forex market don’t happen randomly, they are often driven by key economic factors like interest rates and inflation. These fo...

Best Trading Tools & Resources Every Trader Should Use
Most traders don’t rely on guesswork anymore. They try to understand how the market is moving before making a decision. To achieve this, they...

Forex Market Hours: A Complete Guide to Trading Sessions
The forex market is open 24 hours a day, five days a week, which are its market hours. Within these hours, trading is divided into four major sessio...
What is a Stop-Loss Order? How to Protect Your Trades & Manage Risk
The financial markets can be unpredictable, with prices moving up and down quickly. Even the best strategies can face unexpected changes. In trading...

Fundamental vs. Technical Analysis: Know the Difference!
Every trader, whether they’re placing their very first trade or managing a seasoned portfolio, starts with the same question: “Where...
Best Forex Pairs to Trade for Beginners 2026
The first time in the forex market may be daunting. There are hundreds of combinations that form a currency, and a beginner may be at a loss as to w...
What is the 3-5-7 Rule in Trading?
Risk awareness is one of the largest challenges for any person venturing into the financial markets. Most traders do not fail because they do not kn...
Best Day Trading Platform for Beginners
Day trading is now one of the most interesting and thrilling methods of engaging in financial markets, particularly among novices who would want to...

Understanding Interest Rates in Forex Trading: A Guide for Beginners
The interest rate is one of the strongest variables that determine the price of the currency in the forex trade. Being a novice and wanting to learn...

7 Effective Forex Trading Strategies for 2025
In such a dynamic environment in the forex trading industry, a good strategy is...

Boost Your Algorithmic Trading Strategy with Forex VPS Hosting
Fast time is of the essence in the fast world of Forex trading, and more so when you are using an Algorithmic Trading Strategy to run your trades. T...

How do you create a Forex trading bot using ChatGPT?
The forex market is considered to be one of the most liquid and dynamic financial markets in the world. Traders are constantly seeking new means of...

How Economic News Affects Forex Trading?
Economic news is one of the factors that influences the exchange in the forex field. The economy-related events are carefully observed by the trader...

What is Price Action Trading in Forex?
Forex price action trading is the most respectable and time-tested trading strategy in all financial markets. Movement, candlestick patterns, and pr...

Advantages of Using the Best Regulated Brokers for Forex
In recent times, Forex trading has become an exciting way for people to access the global financial markets and benefit from currency movements to g...

The Future of Copy Trading with AI, Bots, and Next-Gen Strategies
Trading is experiencing rapid evolution from the use of new technology and newer techniques. Copy trading has been one of the leading forms of evolu...

AI in Forex Trading: The Benefits and Risks
Forex trading is a lively, fast-paced, worldwide market where technology is more and more important. Forex trading has greatly improved due to the i...
What is Latency? How Does Latency Impact Forex Trading?
Latency is one of those important considerations that are often not spoken about much in online Forex trading. It does not matter whether you are a...

How to Trade Forex Using Crypto
In this fast-evolving financial world, the coupling of crypto with traditional markets has spawned new trading avenues globally. One of the trendy a...

When is the Best Time to Trade the Forex Market?
The Forex market is a volatile global market operating around the clock for five days a week, with opportunity forever knocking on the door for any...
How to Trade Stocks with Leverage 1:5000
Stock trading has never been so simple, and traders now have time-tested methods and advanced technology to capitalize on trading profits. One of th...
Forex MT4 Robot: How to Create and Set Up
In today's fast-paced financial markets, you will find traders searching for tools that will meet their needs. Forex trading has some popular ap...

What is a Forex VPS? Benefits and How to Choose
In today’s era, speed and stability are key to making a potentially profitable trade in currencies. Virtually, a Forex VPS Hosting could be an...

What is Swing Trading in Forex?
Swing trading is an intermediate trading style, a compromise between day trading and longer-term investing. It involves holding onto positions from...
What is Spread in Forex Trading & How is it Calculated?
Forex trading is known as the largest financial market in the entire world and it is a marketplace for everyone who wants to make a potential profit...

What is Base and Quote Currency in Forex
Forex trading is a trading practice of global currencies through trading in pairs all over the world. When you engage in forex trading, you are deal...

Difference Between Copy Trading & Social Trading
In the world of online investing, copy trading, and social trading have emerged as powerful strategies, especially in the forex market. These method...

How to Manage Risk While Copy Trading?
Copy trading has become a popular method that enables traders to copy the transactions of skilled traders. For beginners, it can simplify trading an...

How to Stay Focused and Disciplined in Forex Trading?
In forex trading, there are vast opportunities for traders if they are focused and disciplined. Success in this dynamic market of changing currency...

Tips for Choosing the Right Brokerage Platform for Your Trading Needs
Investors at all levels of experience can find a lot of opportunities in the exciting world of finance. But choosing the right brokerage platform is...
What is a Currency Trading Platform?
Currency trading platforms are software systems that allow traders to participate in trading online currency. They give you a chance to view real-ti...
Exploring the Best Forex Trading Indicators
The use of indicators is crucial while forex trading. Many traders use these indicators daily to help them determine when to buy and sell in the cur...

Types of Hedges and Hedging Techniques
Hedging is like a financial strategy that financial backers should understand and use since it accompanies a lot of advantages. It acts as an invest...
Hedging in Forex Trading
Hedging is a strategic pillar of risk management in the complex world of trading, and understanding its nuances is paramount for any trader navigati...

A Guide to Starting a Hedge Fund and its Benefits
In today’s era, Hedge funds are one of the most well-known investment vehicles. They offer benefits for investors including the ability to pro...
What is Hedging? – An Ultimate Guide
The concept of hedging can be applied to a variety of investments like bonds, commodities, stocks, and currencies. Hedging typically involves the ut...
How to Trade Forex for Beginners
Welcome to the exciting world of Forex investments, where people can make a lot of money by swapping currencies all over the world. The
How to start forex trading?
Forex trading is an exciting market that offers tradable currencies the chance to react to changes quickly through a Forex trading platform. Forex i...
What is Volatility in Forex?
The term 'Volatility' in the context of forex is a measure of the fluctuation in the value of a currency pair over a specific period. It is...

Most Traded Currency Pairs in Forex Market
If we talk about currency pairs then it is imperative to say that their existence in the early 90s gave rise to an entire domain of trading. Nowaday...

Know the Difference between Forex Trading and Stock Trading
The forex trading and the stock trading, are two of the most popular markets for traders of assets. Making the right decision when choosing one of t...

All you need to know about Social Trading: Beginners Guide
Introduction: What is Social Trading? Trading is becoming more and more popular as people now turn to financial markets to provide them...

An Overview to Foreign Exchange Market
Introduction to Foreign Exchange Market The Forex Market (also known as the Forex, FX, or Currency Market) is the over-the-counter (OTC)...
Types of Forex Charts and How to Read
When it comes to trading, there are a lot of different charts that can be used. This article will teach you about the different types of charts and...

5 Profitable Forex Copy Trading Tips
If you're looking for investment alternatives with low-cost and low-risk that also have a higher chance of success rates and rewards, Forex
Know the Top Strategies to Trade Forex in 2022
When it comes to trading foreign currency, it is unquestionably essential to ensure that you have identified the most successful tactics overall. Ke...

Copy Trading Guide and its Advantages and Disadvantages
Getting inspired by colleagues or an expert trader and beginning with trading cryptocurrency sounds incredible. However, it's not that easy; tra...
A Complete Guide to Understand Forex Market!
What is Forex Trading? Forex is the settlement of transactions in any one currency for delivery of another. Its settlement system is ma...

Basic Forex Trading Terminologies Every Trader Should Know?
Trading and investing can be a complicated process. There is a plethora of terms to keep up with, and you need to understand what they mean in order...

Everything You Need to Know About Currency Pairs
What is a currency pair? A currency pair enables the comparison of two distinct currencies' values. Consider the existence of two d...
How Online Financial Trading Works?
How Online Financial Trading Works? With the advent of online financial trading, investors seem to have become more interested in financ...

Best Global Online Forex Broker
The largest and the most actively traded financial market is the foreign exchange market. When it comes to trading in the foreign exchange market, t...

Tips to Understand Online Financial Trading
Tips to Understand Online Financial Trading As in now, every individual wants to invest in some financial asset. Online financial tradin...

What Is Online Financial Trading?
What Is Online Financial Trading – Know the Advantage Investment has now become a lot easier thing than it used to be in earlier t...